Note: In the comparisons shown in the pictures below, the magnitudes of the differences are neither representative nor relevant, and the directionality of the differences shown is irrelevant except for the robusticity/gracilization/fineness of facial features of the face or when specified otherwise.
Which of these two faces looks more feminine?
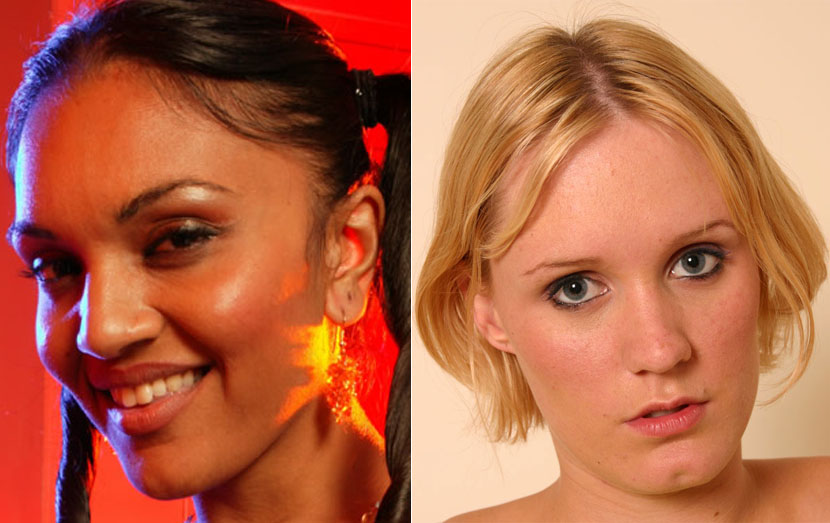
Fig 1a1. Regina from cinnamonbunz (left) and Stormy from Matts models; click image for larger version.
Now look at the physiques of the two women above (Figures 1a2-a3). Who looks more feminine now?

Fig 1a2. Regina from cinnamonbunz (adult site).

Fig 1a3. Stormy from Matts models (adult site).
Which of the women in the next two pictures has a more feminine-looking face?
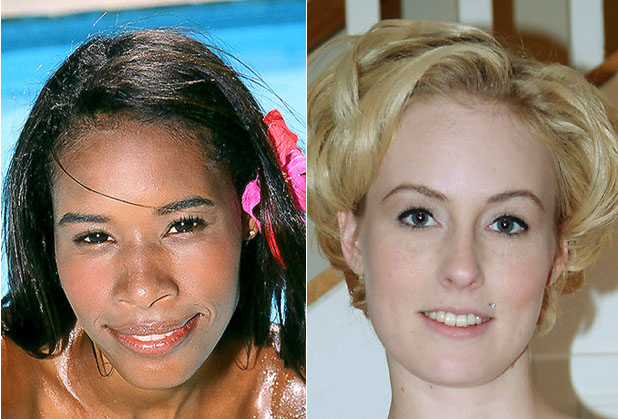
Fig 1b1. Elena from Scoreland (left) and Tanis from ATK galleria (links lead to adult sites).
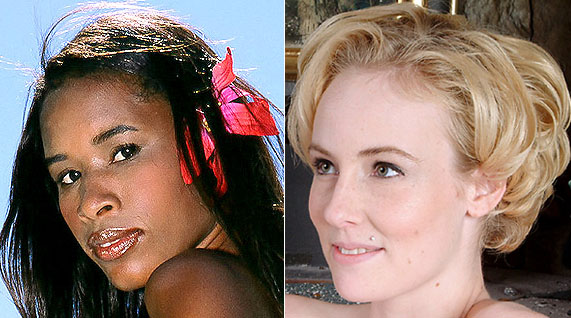
Fig 1b2. Elena from Scoreland (left) and Tanis from ATK galleria (links lead to adult sites).
Now look at the following two pictures of Elena and Tanis and answer who looks more feminine.

Fig 1b3. Elena from Scoreland (left) and Tanis from ATK galleria (links lead to adult sites).
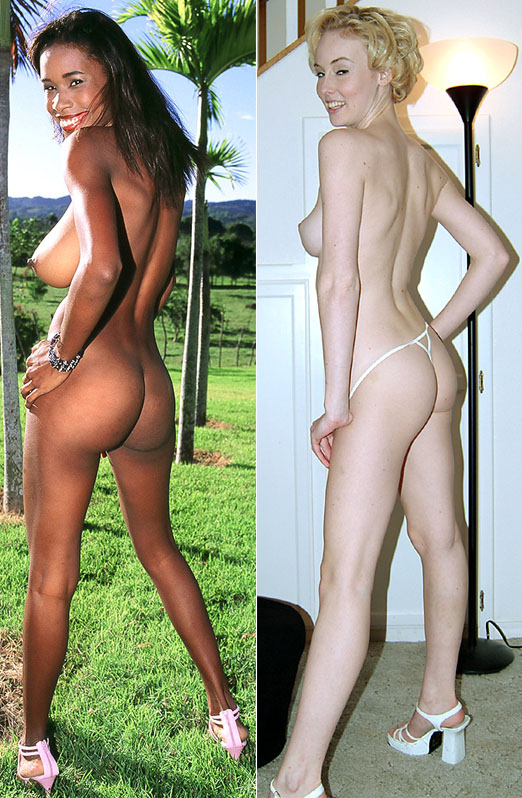
Fig 1b4. Elena from Scoreland (left) and Tanis from ATK galleria (links lead to adult sites).
Which of the women shown below has a more feminine-looking face?
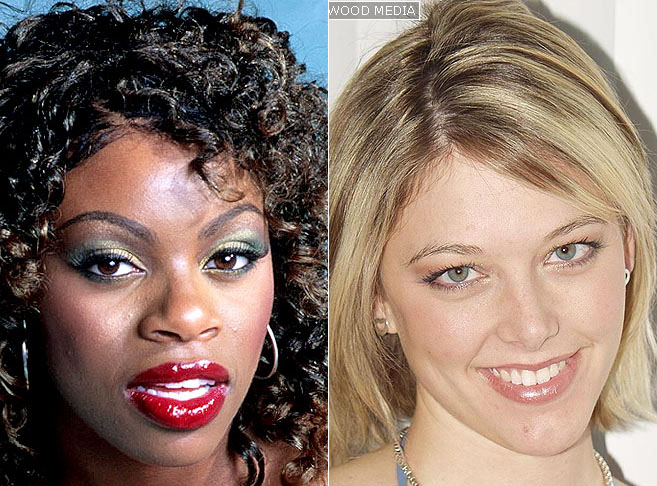
Fig 1c1. Jada from Scoreland (left) and Kyra from Matts Models (links lead to adult sites).
Now look at the following two pictures of Jada and Kyra and answer who looks more feminine.
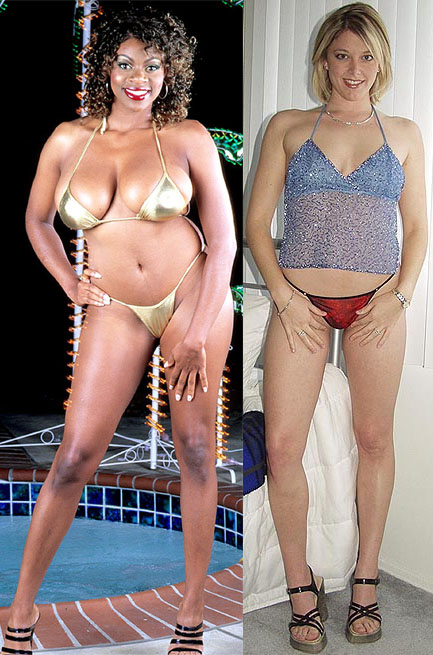
Fig 1c2. Jada from Scoreland (left) and Kyra from Matts Models (links lead to adult sites).
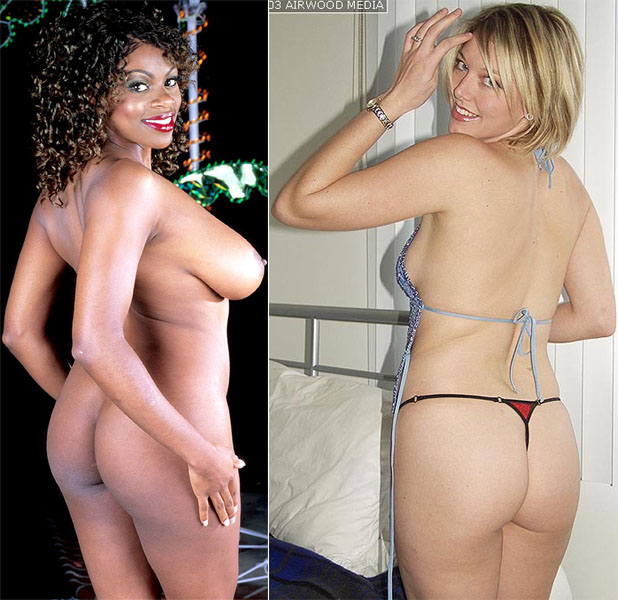
Fig 1c3. Jada from Scoreland (left) and Kyra from Matts Models (links lead to adult sites).
Which of the women in the next two pictures has a more feminine-looking face?
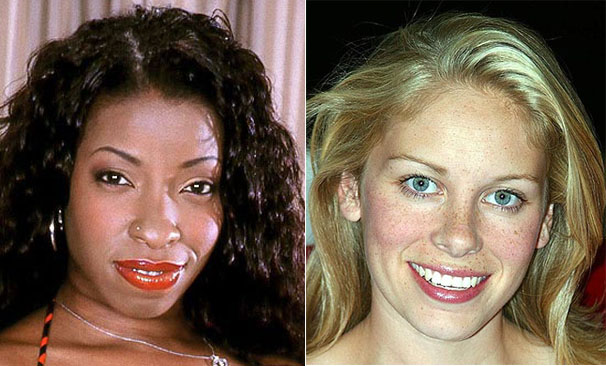
Fig 1d1. Vanessa from Scoreland (left) and Sharon from Matts Models (links lead to adult sites).
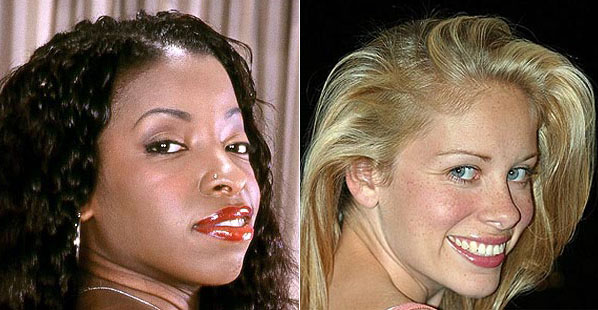
Fig 1d2. Vanessa from Scoreland (left) and Sharon from Matts Models (links lead to adult sites).
Now look at the following two pictures of Vanessa and Sharon and answer who looks more feminine.

Fig 1d3. Vanessa from Scoreland (left) and Sharon from Matts Models (links lead to adult sites).

Fig 1d4. Vanessa from Scoreland (left) and Sharon from Matts Models (links lead to adult sites).
Which of the women in the next three pictures looks more feminine?
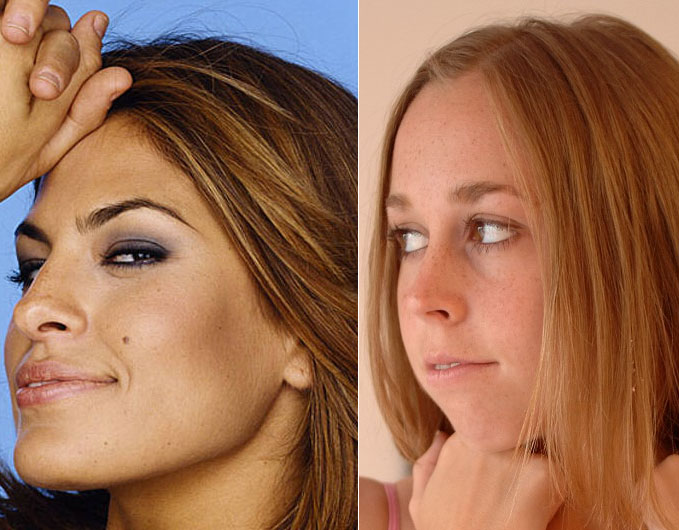
Fig 1e1. Eva Mendes (left) and Lizzy from FTV girls (adult site).
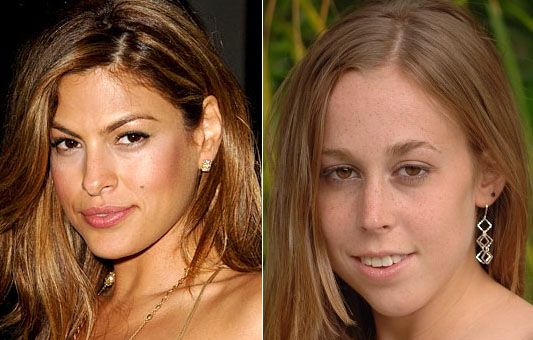
Fig 1e2. Eva Mendes (left) and Lizzy from FTV girls (adult site).
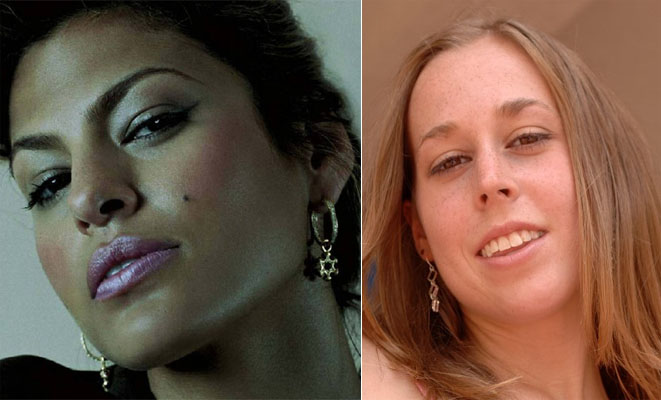
Fig 1e3. Eva Mendes (left) and Lizzy from FTV girls (adult site).
Now compare the skeletal and muscular build of Eva Mendez and Lizzy in the two pictures below.

Fig 1e4. Eva Mendes (left) and Lizzy from FTV girls (adult site).
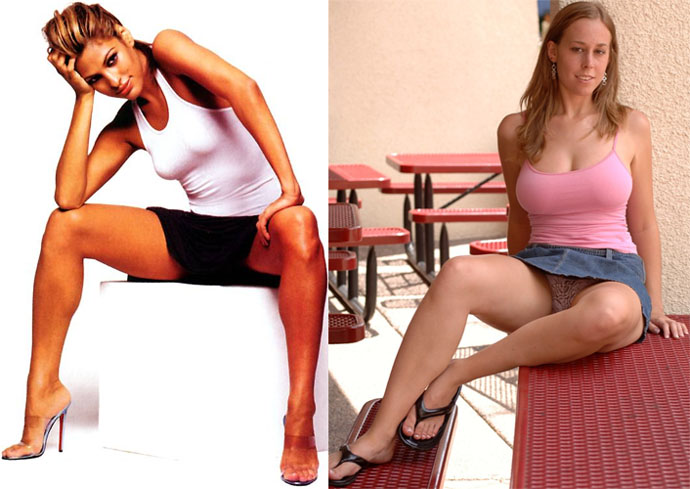
Fig 1e5. Eva Mendes (left) and Lizzy from FTV girls (adult site).
Which of the women in the two images shown below has a more robust face?
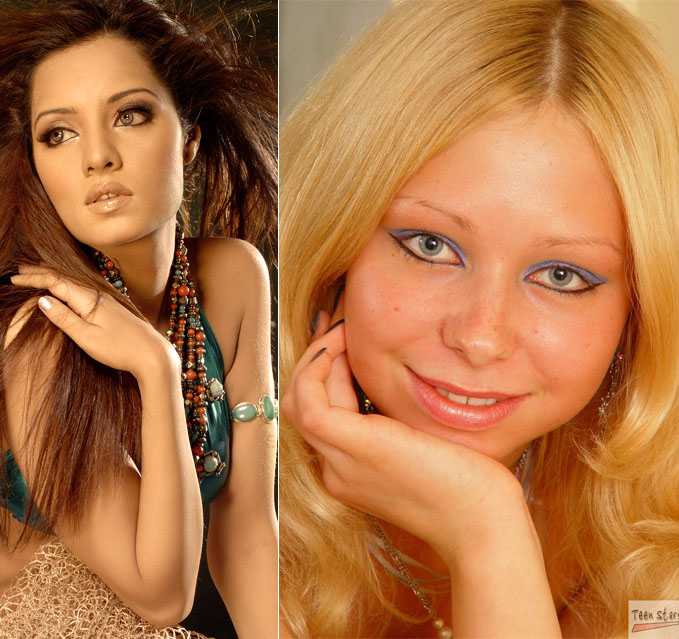
Fig 1f1. Miss India 2001 Celina Jaitley (left) and Ginger from Teen Stars Magazine (adult site).

Fig 1f2. Miss India 2001 Celina Jaitley (left) and Ginger from Teen Stars Magazine (adult site).
Now answer who between Celina Jaitley and Ginger has a more robust body skeleton?
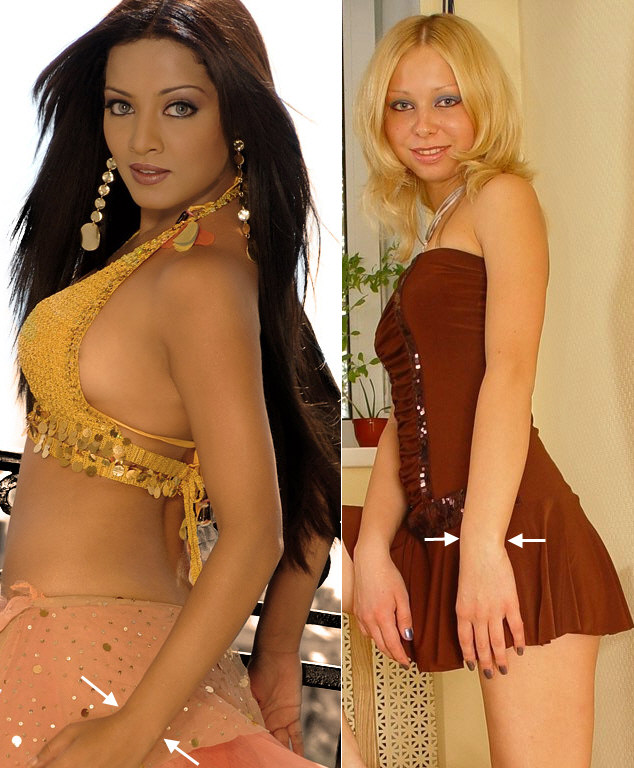
Fig 1f3. Miss India 2001 Celina Jaitley (left) and Ginger from Teen Stars Magazine (adult site).

Fig 1f4. Miss India 2001 Celina Jaitley (left) and Ginger from Teen Stars Magazine (adult site).
In image series 1a to 1d, the European women shown are more masculine than the non-European women they are compared to, yet have faces that look more feminine. It is easy to see that this is because the European women have finer facial features. Thus, robusticity of the face can make it look pseudo-masculine just as fine facial features can add pseudo-femininity to the face.
In image series 1e and 1f, the European women shown have a more robust body musculoskeletal system than the non-European women they are compared to, yet have faces that are less robust and more feminine looking. Thus, it is possible to gracilize or make more robust the facial skeleton/facial features without a corresponding change in the body skeleton.
Those familiar with Northern European phenotypes and the subtlety of masculine vs. feminine face shape variation will easily recognize above average facial masculinization in the European women shown in image series 1a to 1e. However, others may have a difficult time understanding why these women have masculinized faces, and this again goes on to show how finer facial features can add pseudo-femininity to the face.
The choice of masculinized European women in image series 1a to 1e is deliberate. Using feminine European women would not be as effective in showing the extent to which finer facial features can make the face look more feminine in spite of the finer facial-featured woman being more masculine than a woman having a more robust face. For instance, using a feminine European woman as in Fig 1g hardly helps convey this point.
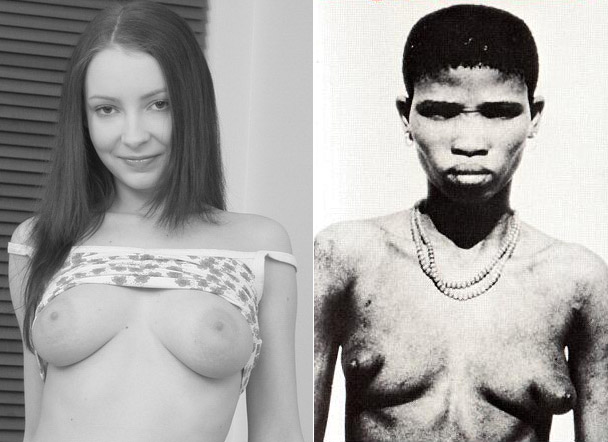
Fig 1g. A European and a !Kung woman.
In anthropology, skull robusticity is typically assessed in terms of non-metric traits, i.e., complex shape variables rather than linear measurements (e.g., Fig 2a). Based on the non-metric items shown in Fig 2a, excluding the features in parentheses, Australian aborigines and some Native American populations (Fueguian/Patagonian) tend to have the most robust skulls, and other populations are more gracile.(1) Continental variation in the extent of robusticity of some features relevant to a visual examination in a living person is shown in Figures 2b-g, using 25 skulls each from 6 major groupings: EU = European (including Neolithic, Bronze age and Iron age skulls), AF = African (North Africa, including skulls from ancient Egypt; West Africa; East Africa; !Kung), SEA = Southeast Asian (Burma, Malaysia, Sarawak, Andaman Islands), EA = East Asia (China, Japan, Tibet, Inuit, Native American), AUS = Australo-Melanesians.(2)
Fig 2a. Some non-metric features used to assess skull robusticity.(1)
Fig 2b. Regional distribution of supraorbital torus robusticity.(2)
Fig 2c. Regional distribution of nasal saddle and nasal roof shape.(2)
Fig 2d. Regional distribution of infraglabellar notch profile.(2)
Fig 2e. Regional distribution of zygomaxillary tuberosity robusticity.(2)
Fig 2f. Regional distribution of zygomatic trigone robusticity.(2)
Fig 2g. Regional distribution of orbital shape.(2)
Only a few of the features in Fig 2a are relevant to a visual examination of a person with a full head of hair. Even though the region around the orbits is most gracile in sub-Saharan Africans, on average, the faces of sub-Saharan African women generally do not look as feminine as those of women in some other populations. Thus, a variety of features such as face size, cheekbone size, jaw size, sharpness of gonial angles, nose breadth, craniofacial haft breadth and various ethnic features also contribute to how robust or fine a face appears to be, and data concerning these variables have been addressed previously. Some illustrations of facial robusticity/ethnic features in the context of making the face appear masculinized are provided in the Fig 3 series.
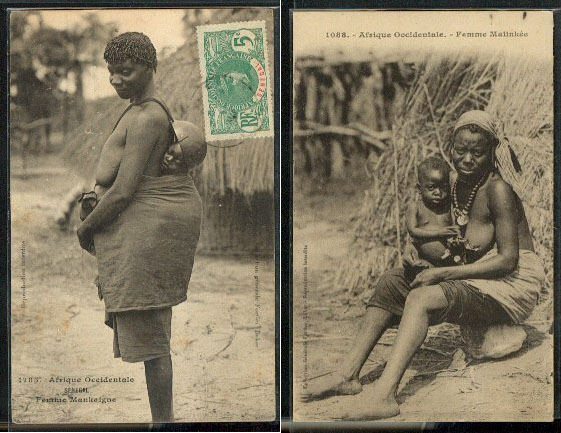
Fig 3a1. Senegalese women.
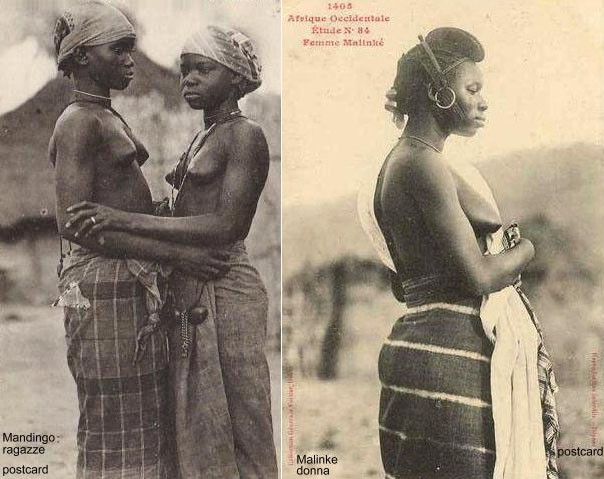
Fig 3a2. African women.
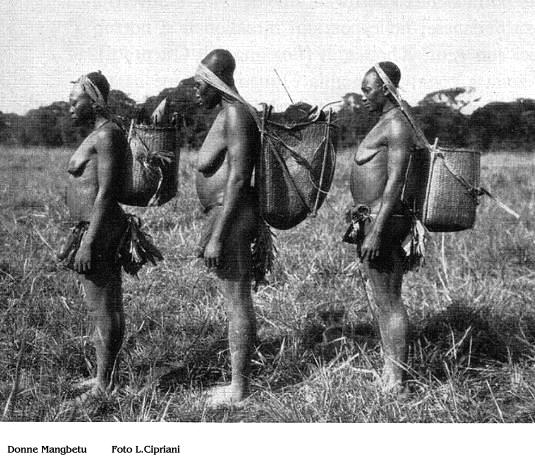
Fig 3a3. Mangbetu women (Congo).
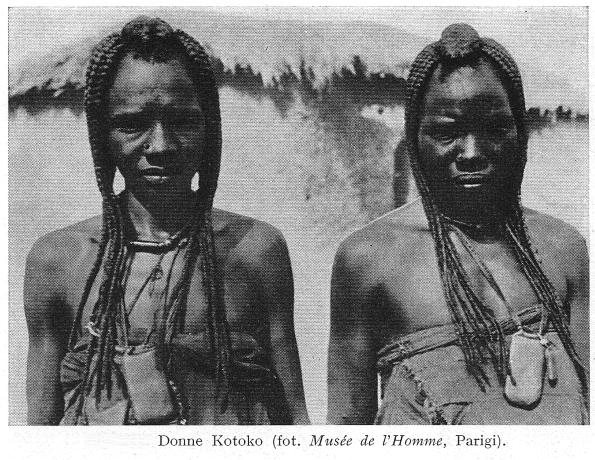
Fig 3a4. Kotoko women.
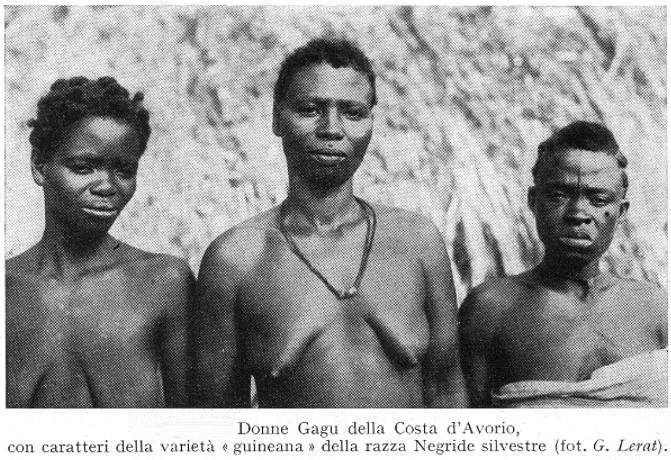
Fig 3a5. Women from the Ivory Coast.
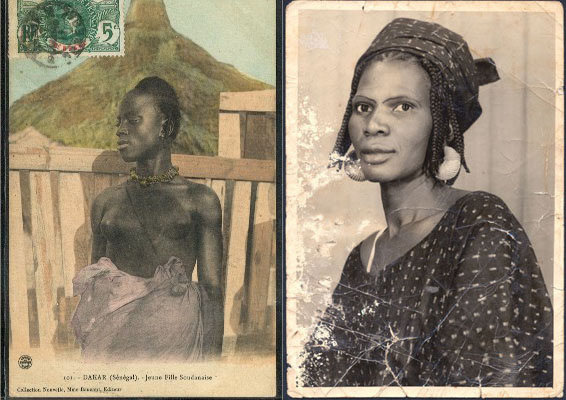
Fig 3a6. A Sudanese woman (left) and a Bondou woman (Guinea).

Fig 3a7. An African woman with a larger and more robust face than a taller European man.

Fig 3b1. The larger and more robust face of an East Asian.
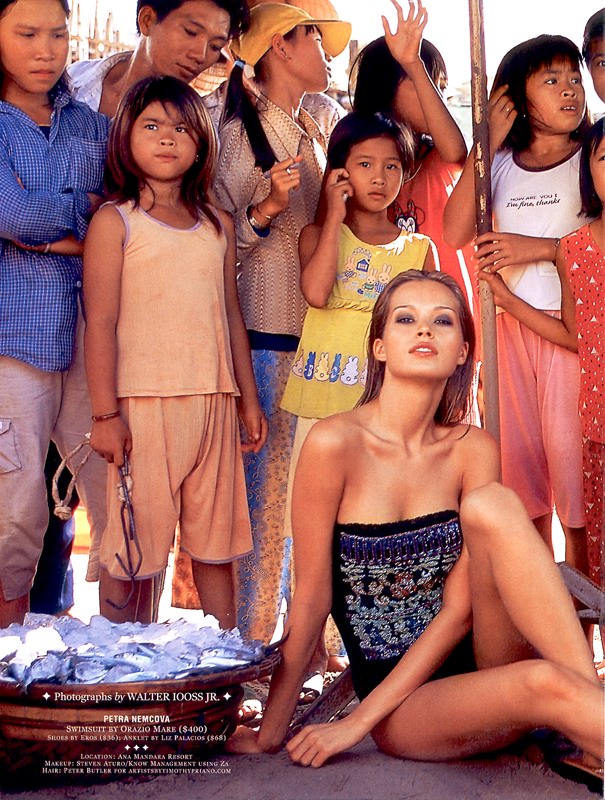
Fig 3b2. East Asian children approaching the face size of an adult Central European with robust cheekbones (Petra Nemcova).

Fig 3b3. A shorter East Asian male (Thai Prime Minister Thaksin Shinawatra) with a much larger face than a taller and somewhat masculinized European woman (Miss Universe 2005 Natalie Glebova).

Fig 3b4. Chinese; note face size relative to body size; Zhang from Simonscans (adult site).

Fig 3b5a. East Asian; note size and robusticity of the face in reference to the size and robusticity of her body, and contrast her with the European woman in image series 1e above. The skeletal and muscular development of the body is weaker in East Asians and especially South Asians compared to Europeans and sub-Saharan Africans, thereby resulting is some remarkable examples -- within normal variation -- of a robust-face-plus-weak-body-skeleton combination among East Asians (this example) and South Asians (e.g., image series 1f above); see related data in Tables 1 & 2 and Fig 3b5b.
| Table 1. Body fat and BMI in various populations.(3) |
 |
Fig 3b5b. Difference in body mass index (weight divided by the square of the height) for the same amount of body fat. For a given amount of body fat, compared to Europeans, lean body mass is greater in West Africans and Polynesians, but lesser in Chinese, Thais, Ethiopians and Indonesians. These differences result from the weaker musculo-skeletal builds of East Asians and East Africans, the greater bone mass of West Africans and the larger trunks and thereby lean body mass of Polynesians.(3)
| Table 2. A table from a study by Dudeja et al.(4) |
 |

Fig 3c. Lebanese (Mona Ayoub); likely not genuinely masculine, but note the robusticity of her face.

Fig 3d. The taller Northern European with a more robust body build nevertheless has finer facial features than the dark European.
An example of the importance of the fineness of facial features in a European context can be seen in the four images below, whereby it is clear which of the two women is more feminine. However, when the faces of the two women are compared, it is obvious that the extent of Europeanization and fineness of facial features in the masculine woman is such that it should not be surprising if some lifetime-exclusive heterosexual white men prefer the Northern European over the dark European. The masculinization level of the Northern European is deliberately chosen to emphasize the importance of fine facial features in aesthetics.
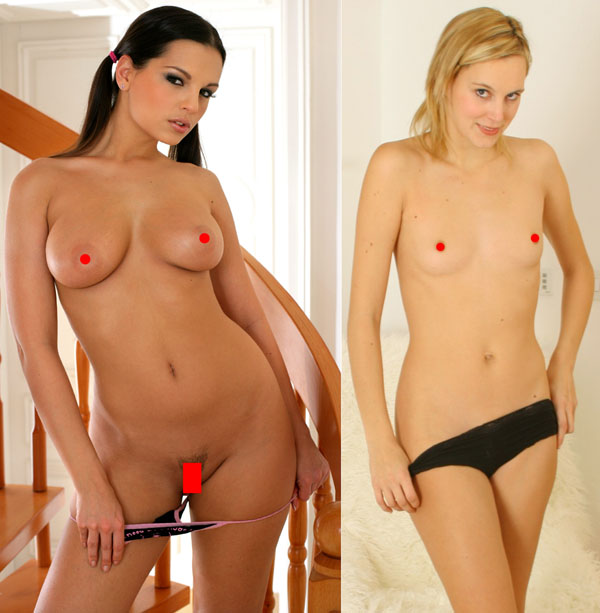
Fig 3e1. Eva from Met Art (left) and Joceline from only tease; links lead to adult sites.

Fig 3e2. Eva from Met Art (left) and Joceline from only tease; links lead to adult sites.
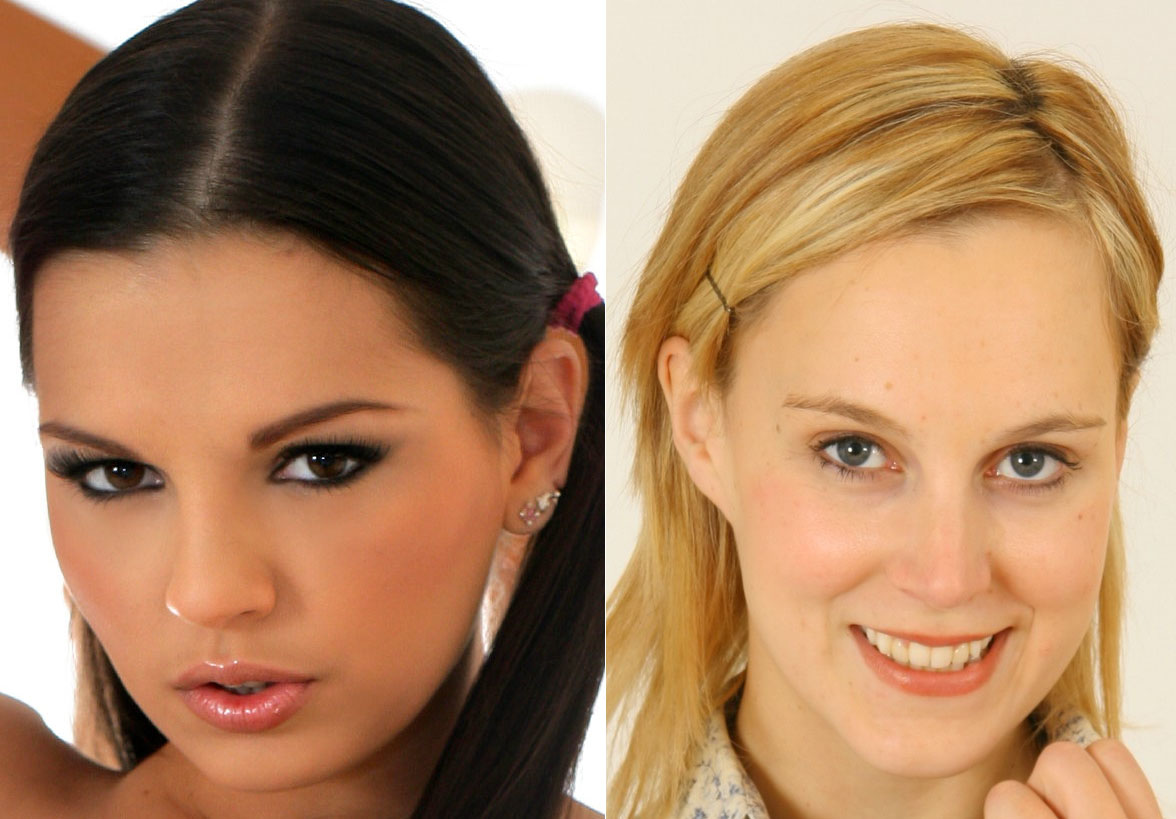
Fig 3e3. Eva from Met Art (left) and Joceline from only tease; click image for larger version.

Fig 3e4. Eva from Met Art (left) and Joceline from only tease; click image for larger version.
Data regarding the greater robusticity of the faces of Mediterranean populations (Southern Europeans and Middle Easterners) compared to Northern Europeans has not been addressed previously, but is mentioned below.
Brace et al. evaluated 24 craniofacial measurements in a sample of 1,282 skulls from modern and prehistoric Europe, the Middle East, parts of Africa and from the Mongolian Bronze age (not related to modern Mongolians but related to prehistoric Europeans and North American Amerindians).(5) The craniofacial measurements involved the nasal region, face breadth, and some cranial measurements; the teeth and jaws were excluded to emphasize selection-neutral measurements. The dendogram resulting from joining neighbors is shown in Fig 4a.
Fig 4a. Neighbor-joining dendogram for 24 craniofacial measurements in the modern and prehistoric populations shown.(5)
Fig 4a shows that Southern European and Middle Eastern populations are more closely related to prehistoric and thereby more robust skulls than Northern and Central Europeans.
A simplified picture of the data in Fig 4a is shown in Fig 4b by combining close groups as follows: Czech, Denmark, England, Etruscan, Finn-Sami, France, Germany, Iceland, Norway, Sardinia, and Swiss (Modern Europe); Algeria, Berber, Greece, Iran-Iraq, Italy, Morocco, Sicily, and Tunisia (Modern Mediterranean); Algerian Neolithic; Congo, Dahomey, and Haya (Niger-Congo twig); Neolithic samples from Denmark, England, France, Germany, and Portugal plus Bronze Age samples from England, Jericho, and Mongolia (Late Prehistoric Eurasia); Portuguese Mesolithic, Greek Neolithic, Italy Eneolithic, Swiss Neolithic, and the Italian and Greek Bronze Age samples (Prehistoric Mediterranean); Naqada Bronze Age Egyptian, Nubians, Nubia Bronze Age, Israeli Fellaheen (Arabic farmers), and Somali samples (Prehistoric-Recent Northeast Africa); Natufian; Basques; Canary Islanders.
Fig 4b. Neighbor-joining dendogram for 18 craniofacial measurements for combined adjacent groups shown in Fig 4a.(5)
The Mahalanobis distances between the twigs in Fig 4b are shown in Table 3.
| Table 3. Mahalanobis distances between the twigs in Fig 4b.(5)* |
 |
| *Based on 18 of the 24 craniofacial measurements. |
In Northern Europe, it is not difficult to come across masculine women (Fig 5a) that have such fine facial features that they look like Greek Goddesses (Fig 5b). Therefore, when one comes across more feminine Northern European women -- than the woman shown in Fig 5b -- with facial features on the robust side of average (Fig 5c-d), then it is difficult to see these women making the ranks of the very attractive among Northern Europeans, though non-Nordic women with a comparable physique and facial robusticity will be seen as relatively better looking within their respective ethnic groups.
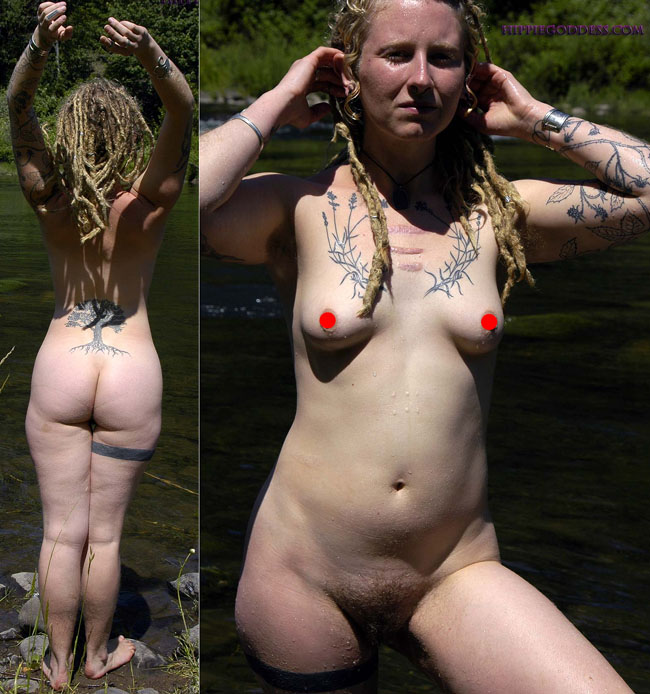
Fig 5a. From Hippie Goddess (adult site).

Fig 5b. From Hippie Goddess (adult site).

Fig 5c. Kay Margaret Anderson; Miss World 2005 contestant from New Zealand.
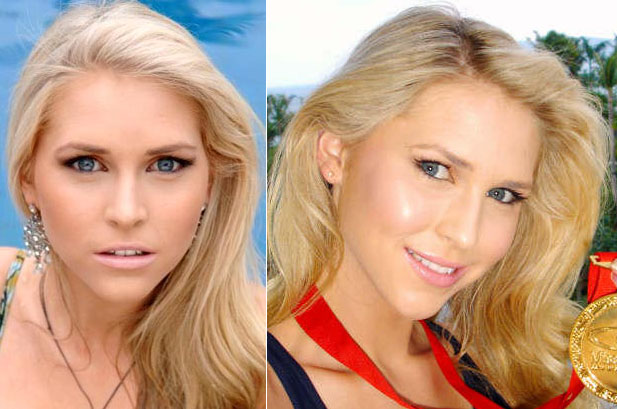
Fig 5d. Kay Margaret Anderson; Miss World 2005 contestant from New Zealand.
Comment
The extent of feminine appearance of facial features is very important in a true beauty contest, but given population differences regarding this variable, there are problems with comparing the attractiveness of women from different geographic populations. For instance, specifying the population with the most feminine-looking faces as the reference standard would make it harder for women from other populations to compete, but specifying a feminine appearance in between the population extremes would imply that the most attractive women from populations harboring women with the most feminine-looking faces cannot be allowed to participate.
References
- Lahr, M. M., and Wright, R. V. S., The question of robusticity and the relationship between cranial size and shape in Homo sapiens, J Hum Evol, 31, 157 (1996).
- Lahr, M. M., The multiregional model of modern human origins: a reassessment of its morphological basis, J Hum Evol, 26, 23 (1994).
- Deurenberg, P., Yap, M., and van Staveren, W. A., Body mass index and percent body fat: a meta analysis among different ethnic groups, Int J Obes Relat Metab Disord, 22, 1164 (1998).
- Dudeja, V., Misra, A., Pandey, R. M., Devina, G., Kumar, G., and Vikram, N. K., BMI does not accurately predict overweight in Asian Indians in northern India, Br J Nutr, 86, 105 (2001).
- Brace, C. L., Seguchi, N., Quintyn, C. B., Fox, S. C., Nelson, A. R., Manolis, S. K., and Qifeng, P., The questionable contribution of the Neolithic and the Bronze Age to European craniofacial form, Proc Natl Acad Sci U S A, 103, 242 (2006).